This function subsets the numeric columns from the input data and compares them based on a selected grouping column. It computes the fold changes (ratio of means) and associated p-values (using two-sample t-tests) for each numeric variable between two groups. The results are log2-transformed (for fold change) and -log10-transformed (for p-values) to generate volcano plots.
Usage
cyt_volc(
  data,
  group_col,
  cond1 = NULL,
  cond2 = NULL,
  fold_change_thresh = 2,
  p_value_thresh = 0.05,
  top_labels = 10,
  output_file = NULL,
  font_settings = NULL,
  progress = NULL
)
Arguments
- data
A matrix or data frame containing the data to be analyzed.
- group_col
A character string specifying the column name used for comparisons.
- cond1
A character string specifying the name of the first condition for comparison. If empty, all pairwise comparisons will be generated.
- cond2
A character string specifying the name of the second condition for comparison. If empty, all pairwise comparisons will be generated.
- fold_change_thresh
A numeric threshold for the fold change. Default is 2.
- p_value_thresh
A numeric threshold for the p-value. Default is 0.05.
- top_labels
An integer specifying the number of top variables to label on the plot. Default is 10.
- output_file
Optional. A file path to save the plot. If NULL (default), the function returns a list of ggplot objects.
- font_settings
Optional named list of font sizes for supported plot text elements.
- progress
Optional. A Shiny
Progressobject for reporting progress updates.
Value
If output_file is NULL, a list of ggplot objects (one per pair) is returned. If output_file is provided, the plot(s) are written to that file and the function returns NULL invisibly.
Details
If both cond1 and cond2 are provided (non-empty), only that pair is compared. Otherwise, the function automatically generates all possible pairwise comparisons.
Examples
# Loading data
data_df <- ExampleData1[,-c(2:3)]
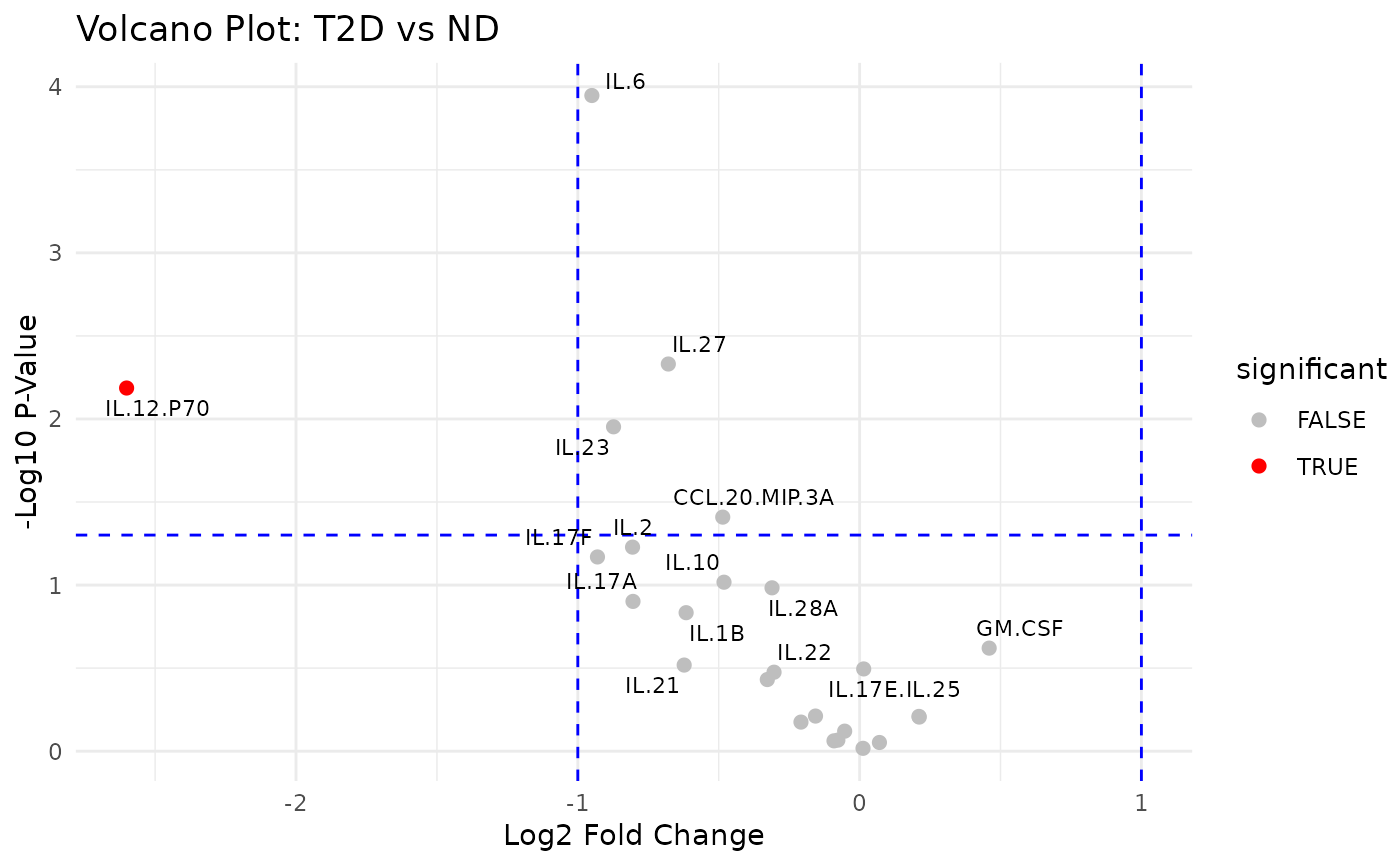
cyt_volc(data_df, "Group", cond1 = "T2D", cond2 = "ND",
fold_change_thresh = 2.0, top_labels= 15)
#> $plot
 #>
#> $stats
#> variable log2_fold_change p_value direction
#> IL.12.P70 IL.12.P70 2.60117683 2.18641971 Upregulated
#> IL.6 IL.6 0.95013174 3.94758527 Not Significant
#> IL.27 IL.27 0.67878724 2.33099419 Not Significant
#> IL.23 IL.23 0.87320747 1.95290632 Not Significant
#> CCL.20.MIP.3A CCL.20.MIP.3A 0.48569948 1.40917287 Not Significant
#> IL.2 IL.2 0.80577278 1.22848122 Not Significant
#> IL.17F IL.17F 0.93024059 1.16938373 Not Significant
#> IL.10 IL.10 0.48121242 1.01734902 Not Significant
#> IL.28A IL.28A 0.31081278 0.98351262 Not Significant
#> IL.17A IL.17A 0.80415853 0.90173665 Not Significant
#> IL.1B IL.1B 0.61564856 0.83381951 Not Significant
#> GM.CSF GM.CSF -0.45980342 0.62042612 Not Significant
#> IL.21 IL.21 0.62254771 0.51843946 Not Significant
#> IL.17E.IL.25 IL.17E.IL.25 -0.01449957 0.49515782 Not Significant
#> IL.22 IL.22 0.30363695 0.47550506 Not Significant
#> IL.9 IL.9 0.32752255 0.43117675 Not Significant
#> TNF.A TNF.A 0.15647551 0.21142412 Not Significant
#> IL.31 IL.31 -0.21056699 0.20929529 Not Significant
#> IL.4 IL.4 -0.21161574 0.20542291 Not Significant
#> IL.5 IL.5 0.20808037 0.17512546 Not Significant
#> IL.15 IL.15 0.05298748 0.12055764 Not Significant
#> IL.13 IL.13 0.07717527 0.06654004 Not Significant
#> IFN.G IFN.G 0.09088794 0.06221451 Not Significant
#> TNF.B TNF.B -0.07037796 0.05224667 Not Significant
#> IL.33 IL.33 -0.01213249 0.01719622 Not Significant
#>
#>
#> $stats
#> variable log2_fold_change p_value direction
#> IL.12.P70 IL.12.P70 2.60117683 2.18641971 Upregulated
#> IL.6 IL.6 0.95013174 3.94758527 Not Significant
#> IL.27 IL.27 0.67878724 2.33099419 Not Significant
#> IL.23 IL.23 0.87320747 1.95290632 Not Significant
#> CCL.20.MIP.3A CCL.20.MIP.3A 0.48569948 1.40917287 Not Significant
#> IL.2 IL.2 0.80577278 1.22848122 Not Significant
#> IL.17F IL.17F 0.93024059 1.16938373 Not Significant
#> IL.10 IL.10 0.48121242 1.01734902 Not Significant
#> IL.28A IL.28A 0.31081278 0.98351262 Not Significant
#> IL.17A IL.17A 0.80415853 0.90173665 Not Significant
#> IL.1B IL.1B 0.61564856 0.83381951 Not Significant
#> GM.CSF GM.CSF -0.45980342 0.62042612 Not Significant
#> IL.21 IL.21 0.62254771 0.51843946 Not Significant
#> IL.17E.IL.25 IL.17E.IL.25 -0.01449957 0.49515782 Not Significant
#> IL.22 IL.22 0.30363695 0.47550506 Not Significant
#> IL.9 IL.9 0.32752255 0.43117675 Not Significant
#> TNF.A TNF.A 0.15647551 0.21142412 Not Significant
#> IL.31 IL.31 -0.21056699 0.20929529 Not Significant
#> IL.4 IL.4 -0.21161574 0.20542291 Not Significant
#> IL.5 IL.5 0.20808037 0.17512546 Not Significant
#> IL.15 IL.15 0.05298748 0.12055764 Not Significant
#> IL.13 IL.13 0.07717527 0.06654004 Not Significant
#> IFN.G IFN.G 0.09088794 0.06221451 Not Significant
#> TNF.B TNF.B -0.07037796 0.05224667 Not Significant
#> IL.33 IL.33 -0.01213249 0.01719622 Not Significant
#>