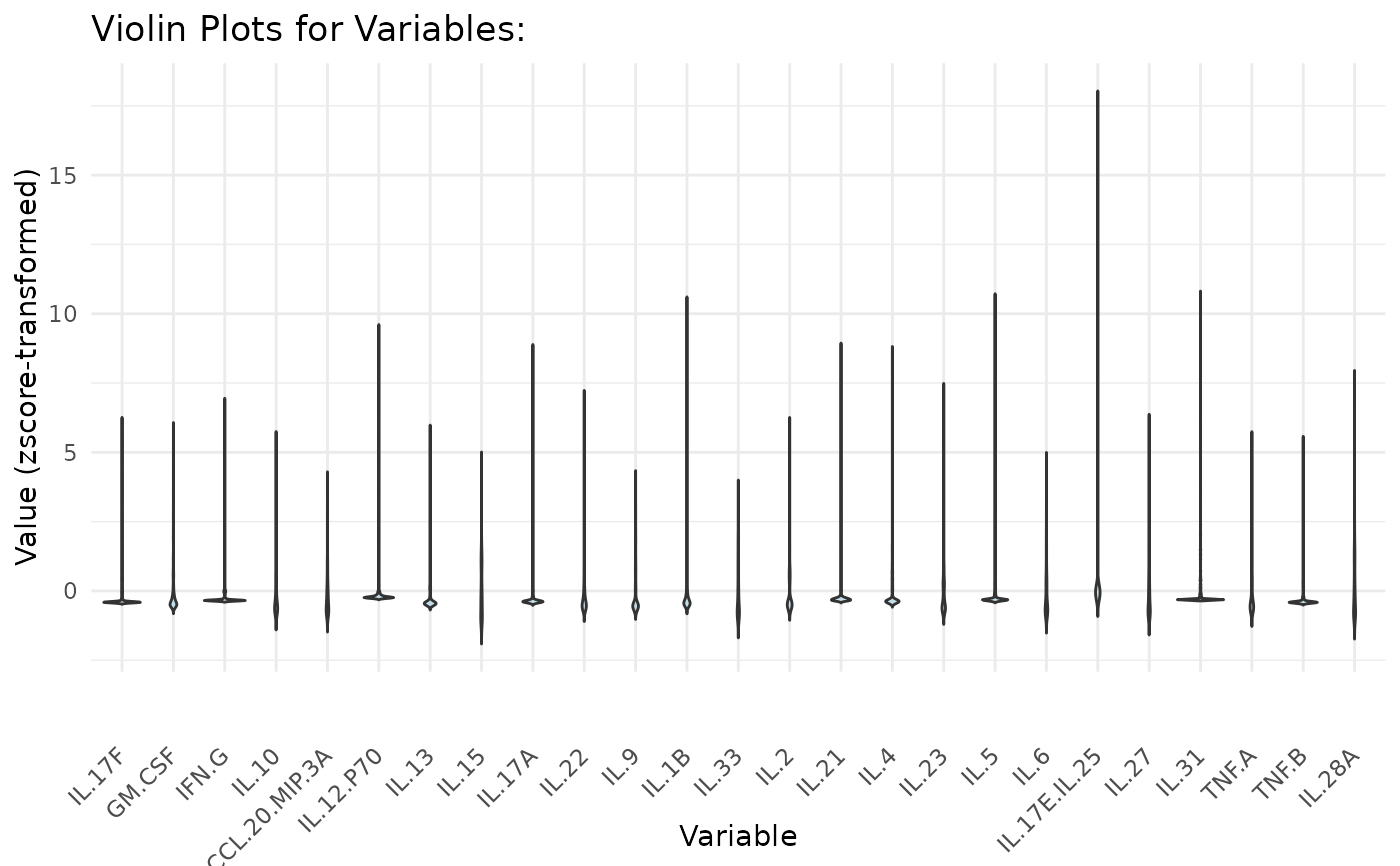
cyt_violin produces violin plots for each numeric variable in
data, optionally grouped by one or more categorical variables.
When grouping is not specified, the function behaves similarly to
cyt_bp but uses violins instead of boxplots and supports
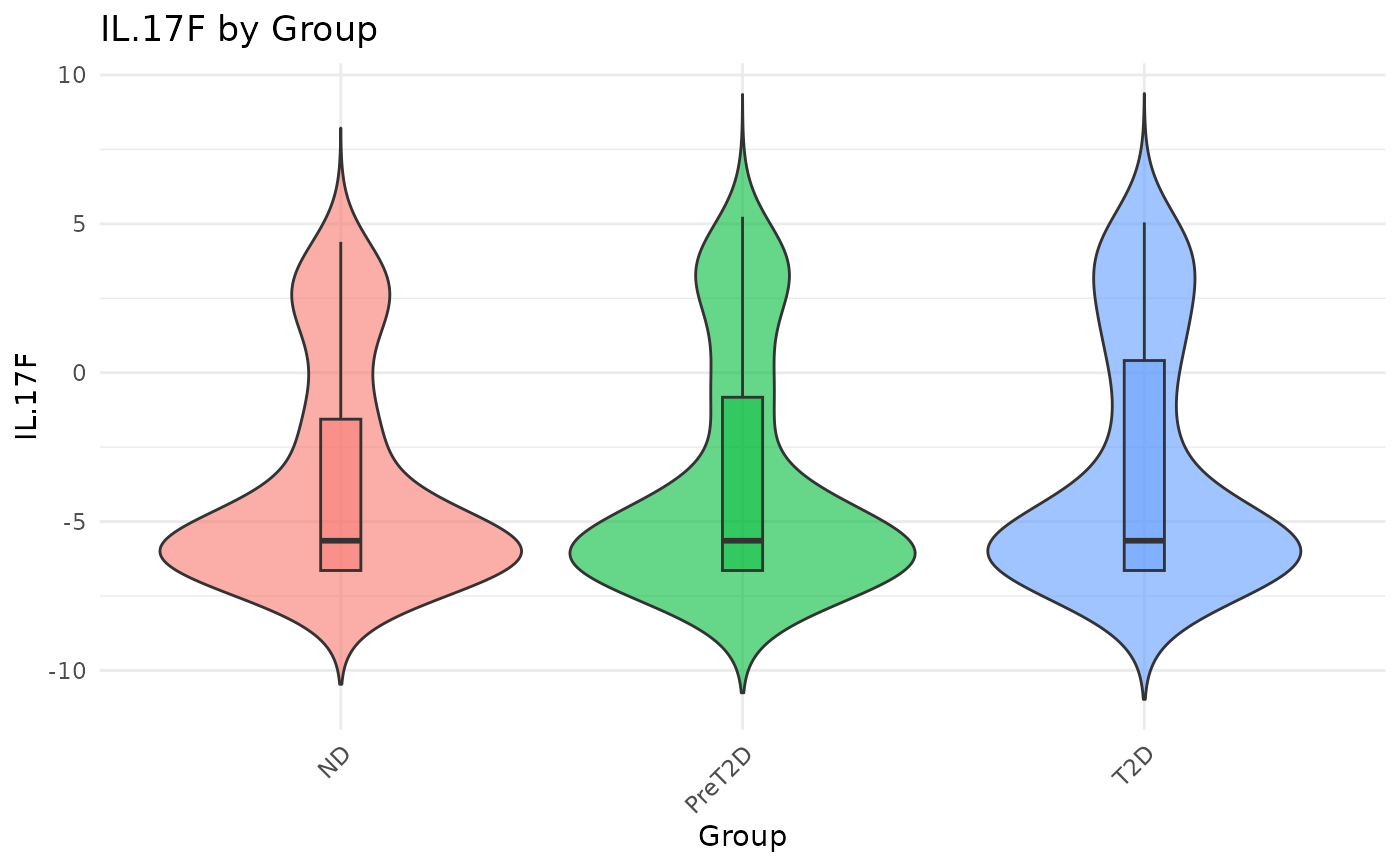
pagination via the bin_size argument. When grouping is provided,
a separate violin is drawn for each level (or interaction of levels) of
the grouping variables. Users may optionally overlay boxplots within
each violin to visualize the median and interquartile range.
Usage
cyt_violin(
  data,
  output_file = NULL,
  group_by = NULL,
  bin_size = 25,
  y_lim = NULL,
  scale = c("none", "log2", "log10", "zscore", "custom"),
  custom_fn = NULL,
  boxplot_overlay = FALSE,
  font_settings = NULL,
  progress = NULL
)
Arguments
- data
A matrix or data frame containing numeric and categorical variables.
- output_file
Optional string specifying the name of the file to be created. When
NULL(default), plots are drawn on the current graphics device. Ensure the file extension matches the desired format (e.g.,".pdf",".png",".tiff").- group_by
Optional character vector specifying one or more columns to use for grouping. If
NULL(default) no grouping is applied.- bin_size
Integer. Maximum number of violins per page when grouping is not used. Default is
25, mirroringcyt_bp.- y_lim
Optional numeric vector giving y-axis limits for the plots. Applies to all plots.
- scale
Character specifying a transformation for numeric variables. One of
"none","log2","log10","zscore", or"custom". When"custom", supply a function viacustom_fn.- custom_fn
A user-supplied function to transform numeric columns when
scale = "custom".- boxplot_overlay
Logical. When
TRUE, a narrow boxplot is drawn inside each violin to summarize the median and quartiles. Default isFALSE.- font_settings
Optional named list of font sizes for supported plot text elements.
- progress
Optional. A Shiny
Progressobject for reporting progress updates.