Analyze data with Sparse Partial Least Squares Discriminant Analysis (sPLS-DA).
Source:R/cyt_splsda.R
cyt_splsda.RdAnalyze data with Sparse Partial Least Squares Discriminant Analysis (sPLS-DA).
Usage
cyt_splsda(
  data,
  group_col,
  group_col2 = NULL,
  batch_col = NULL,
  ind_names = FALSE,
  multilevel_col = NULL,
  var_num,
  comp_num = 2,
  cv_opt = NULL,
  fold_num = 5,
  seed = 123456,
  scale = NULL,
  custom_fn = NULL,
  ellipse = FALSE,
  bg = FALSE,
  roc = FALSE,
  conf_mat = FALSE,
  style = NULL,
  splsda_colors = NULL,
  pch_values = NULL,
  output_file = NULL,
  font_scale = 1,
  font_settings = NULL,
  progress = NULL
)
Arguments
- data
A matrix or data frame containing the variables. Columns not specified by
group_col,group_col2, ormultilevel_colare assumed to be continuous variables for analysis.- group_col
A string specifying the first grouping column name that contains grouping information. If
group_col2is not provided, it will be used for both grouping and treatment.- group_col2
A string specifying the second grouping column name. Default is
NULL.- batch_col
A string specifying the column that identifies the batch or study for each sample.
- ind_names
If
TRUE, the row names of the first (or second) data matrix is used as names. Default isFALSE. If a character vector is provided, these values will be used as names. If 'pch' is set this will overwrite the names as shapes. See ?mixOmics::plotIndiv for details.- multilevel_col
A string specifying the column name that identifies repeated measurements (e.g., patient or sample IDs). If provided, a multilevel analysis will be performed. Default is
NULL.- var_num
Numeric. The number of variables to be used in the PLS-DA model.
- comp_num
Numeric. The number of components to calculate in the sPLS-DA model. Default is 2.
- cv_opt
Character. Option for cross-validation method: either "loocv" or "Mfold". Default is
NULL.- fold_num
Numeric. The number of folds to use if
cv_optis "Mfold". Default is 5.- seed
Optional integer seed for reproducible cross-validation. Default is
123.- scale
Character. Optional transformation applied to numeric predictors. Supported values are
NULL(default; no transformation),"none","log2","log10","zscore", or"custom".- custom_fn
Optional transformation function used when
scale = "custom".- ellipse
Logical. Whether to draw a 95\ Default is
FALSE.- bg
Logical. Whether to draw the prediction background in the figures. Default is
FALSE.- roc
Logical. Whether to compute and plot the ROC curve for the model. Default is
FALSE.- conf_mat
Logical. Whether to print the confusion matrix for the classifications. Default is
FALSE.- style
Character. If set to
"3D"or"3d"andcomp_numequals 3, a 3D plot is generated using theplot3Dpackage. Default isNULL.- splsda_colors
A vector of splsda_colors for the groups or treatments. If
NULL, a random palette (usingrainbow) is generated based on the number of groups.- pch_values
A vector of integers specifying the plotting characters (pch values) to be used in the plots.
- output_file
A string specifying the file name for saving the PDF output. If set to NULL, the function runs in interactive mode.
- font_scale
Numeric. Apply a scale to font size in the figures for better readability.
- font_settings
Optional named list of font sizes for supported plot text elements.
- progress
Optional. A Shiny
Progressobject for reporting progress updates.
Value
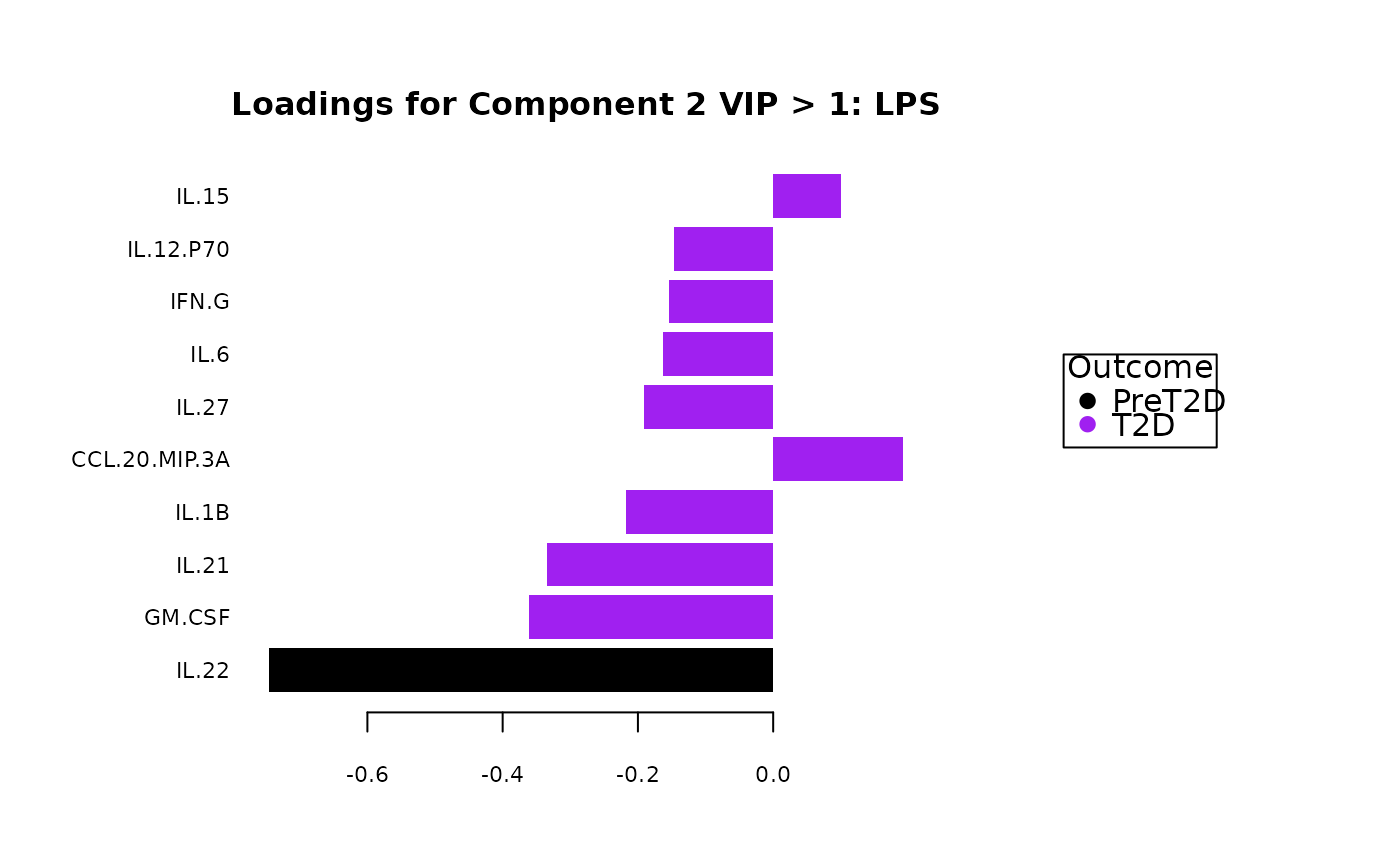
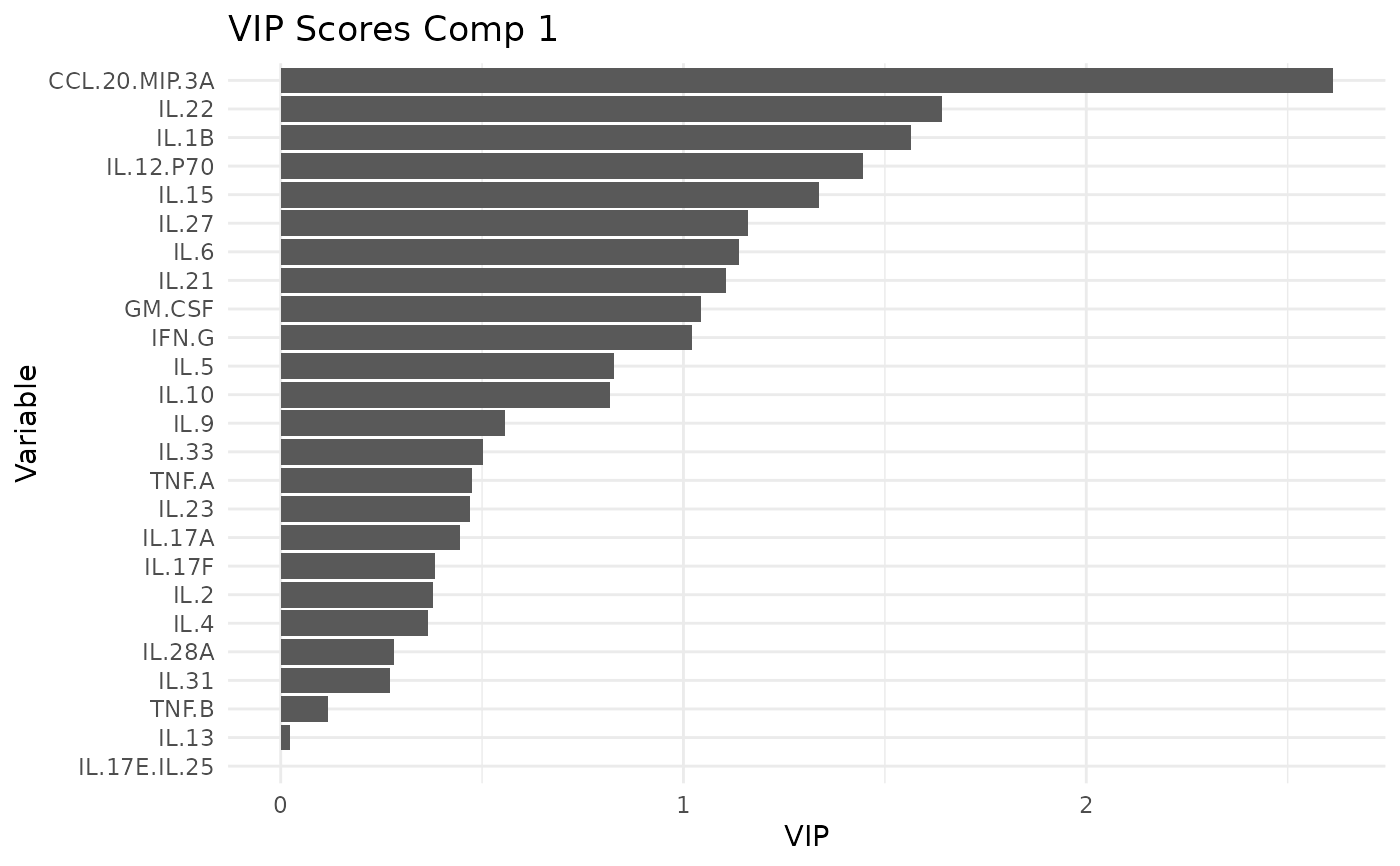
In Download mode (output_file not NULL), a PDF file is written and the function returns NULL invisibly. In Interactive mode (output_file = NULL), a named list is returned with the following elements (in this order): 1. overall_indiv_plot: Main individual classification plot 2. overall_3D: Main 3D plot (if generated) 3. overall_ROC: ROC curve plot for the overall model 4. overall_CV: Cross-validation error plot for the overall model 5. loadings: A list of loadings plots (one per component) 6. vip_scores: A list of VIP score bar plots for each component 7. vip_indiv_plot: Main individual plot for the VIP>1 model 8. vip_3D: 3D plot for the VIP>1 model (if generated) 9. vip_ROC: ROC curve plot for the VIP>1 model 10. vip_CV: Cross-validation error plot for the VIP>1 model 11. conf_matrix: Confusion matrix text output
Examples
data_df <- ExampleData1[,-c(3)]
data_df <- dplyr::filter(data_df, Group != "ND", Treatment != "Unstimulated")
cyt_splsda(data_df, output_file = NULL,
splsda_colors = c("black", "purple"), bg = FALSE, scale = "log2",
conf_mat = FALSE, var_num = 25, cv_opt = NULL, comp_num = 2,
pch_values = c(16, 4), style = NULL, ellipse = TRUE,
group_col = "Group", group_col2 = "Treatment", roc = FALSE)
#> Warning: sPLS-DA dropped unusable predictors before fitting for CD3/CD28 : IL.17E.IL.25 [observed values=66; reasons=zero or undefined SD] Consider Step 2 'Treat missing values' if you want to retain sparse predictors.
 #> Warning: sPLS-DA dropped unusable predictors before fitting for LPS : IL.17E.IL.25 [observed values=66; reasons=zero or undefined SD] Consider Step 2 'Treat missing values' if you want to retain sparse predictors.
 #> $`CD3/CD28`
$overall_indiv_plot
#>
#> $`CD3/CD28`$overall_3D
#> NULL
#>
#> $`CD3/CD28`$overall_3D_interactive
#> NULL
#>
#> $`CD3/CD28`$overall_ROC
#> NULL
#>
#> $`CD3/CD28`$overall_CV
#> NULL
#>
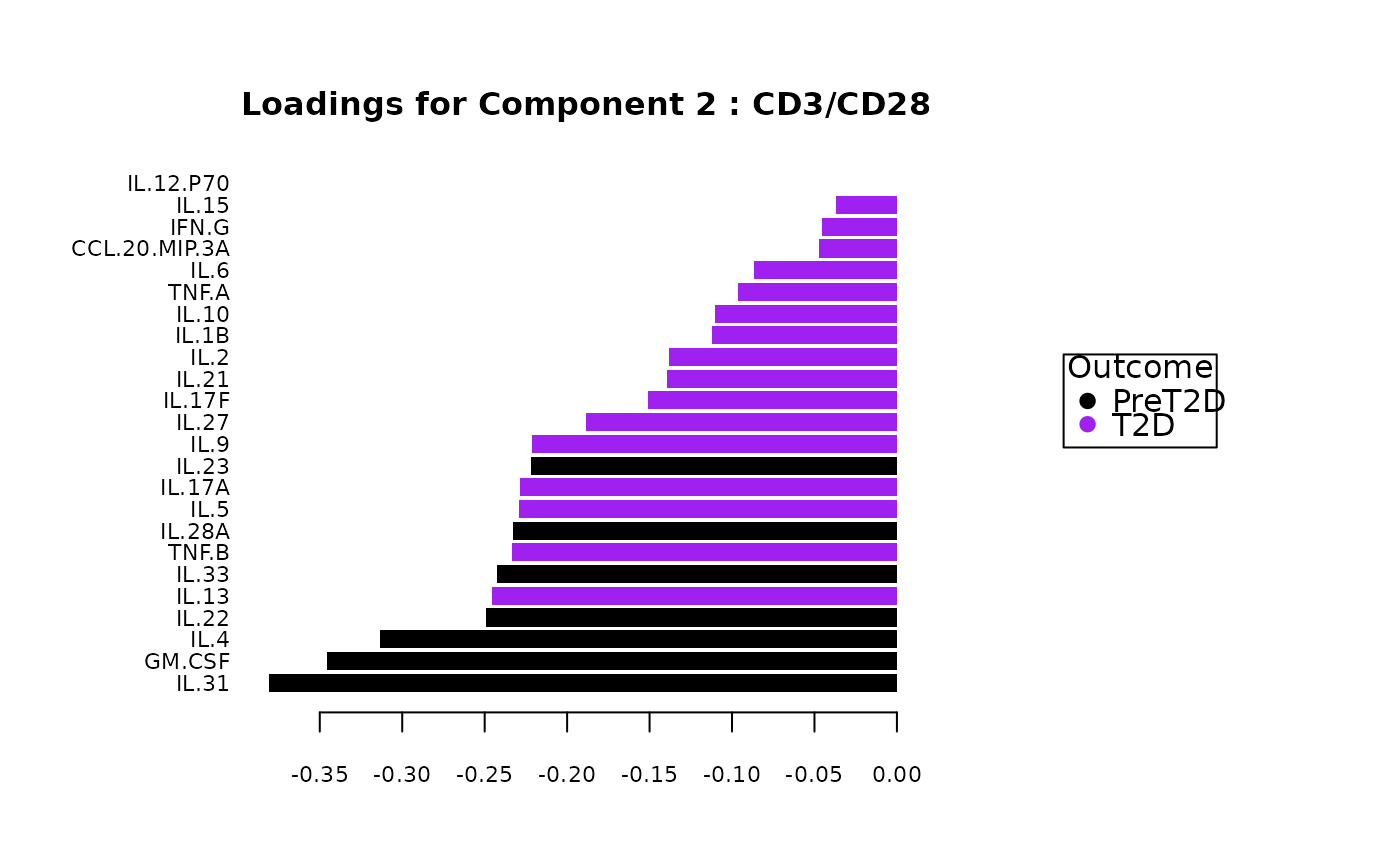
#> $`CD3/CD28`$loadings
#> $`CD3/CD28`$loadings[[1]]
#>
#> $`CD3/CD28`$loadings[[2]]
#>
#>
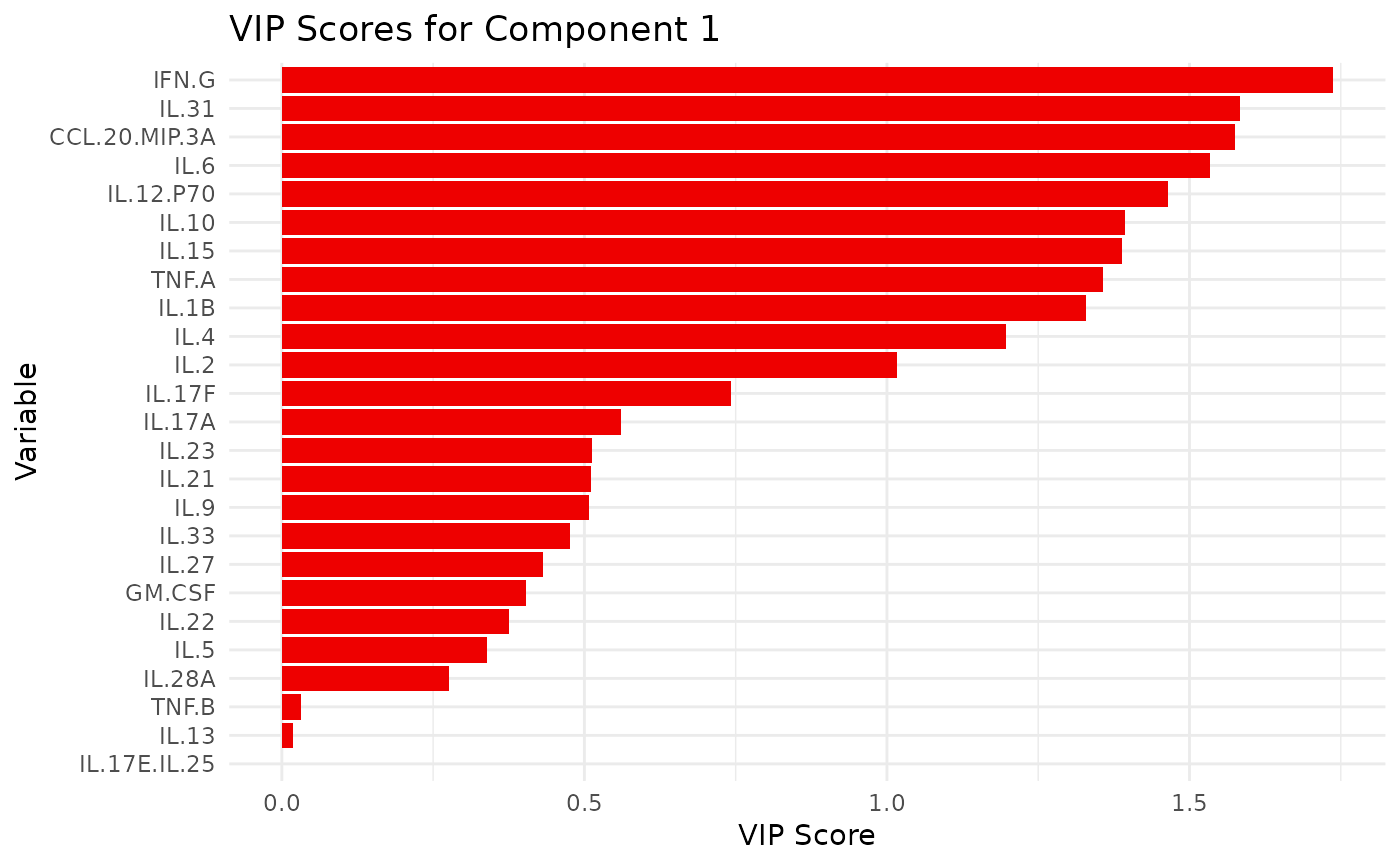
#> $`CD3/CD28`$vip_scores
#> $`CD3/CD28`$vip_scores[[1]]
#> $`CD3/CD28`
#> $`CD3/CD28`$overall_indiv_plot
#>
#> $`CD3/CD28`$overall_3D
#> NULL
#>
#> $`CD3/CD28`$overall_3D_interactive
#> NULL
#>
#> $`CD3/CD28`$overall_ROC
#> NULL
#>
#> $`CD3/CD28`$overall_CV
#> NULL
#>
#> $`CD3/CD28`$loadings
#> $`CD3/CD28`$loadings[[1]]
#>
#> $`CD3/CD28`$loadings[[2]]
#>
#>
#> $`CD3/CD28`$vip_scores
#> $`CD3/CD28`$vip_scores[[1]]
 #>
#> $`CD3/CD28`$vip_scores[[2]]
#>
#> $`CD3/CD28`$vip_scores[[2]]
 #>
#>
#> $`CD3/CD28`$vip_indiv_plot
#>
#> $`CD3/CD28`$vip_loadings
#> $`CD3/CD28`$vip_loadings[[1]]
#>
#> $`CD3/CD28`$vip_loadings[[2]]
#>
#>
#> $`CD3/CD28`$vip_3D
#> NULL
#>
#> $`CD3/CD28`$vip_3D_interactive
#> NULL
#>
#> $`CD3/CD28`$vip_ROC
#> NULL
#>
#> $`CD3/CD28`$vip_CV
#> NULL
#>
#> $`CD3/CD28`$conf_matrix
#> NULL
#>
#>
#> $LPS
#> $LPS$overall_indiv_plot
#>
#> $LPS$overall_3D
#> NULL
#>
#> $LPS$overall_3D_interactive
#> NULL
#>
#> $LPS$overall_ROC
#> NULL
#>
#> $LPS$overall_CV
#> NULL
#>
#> $LPS$loadings
#> $LPS$loadings[[1]]
#>
#> $LPS$loadings[[2]]
#>
#>
#> $LPS$vip_scores
#> $LPS$vip_scores[[1]]
#>
#>
#> $`CD3/CD28`$vip_indiv_plot
#>
#> $`CD3/CD28`$vip_loadings
#> $`CD3/CD28`$vip_loadings[[1]]
#>
#> $`CD3/CD28`$vip_loadings[[2]]
#>
#>
#> $`CD3/CD28`$vip_3D
#> NULL
#>
#> $`CD3/CD28`$vip_3D_interactive
#> NULL
#>
#> $`CD3/CD28`$vip_ROC
#> NULL
#>
#> $`CD3/CD28`$vip_CV
#> NULL
#>
#> $`CD3/CD28`$conf_matrix
#> NULL
#>
#>
#> $LPS
#> $LPS$overall_indiv_plot
#>
#> $LPS$overall_3D
#> NULL
#>
#> $LPS$overall_3D_interactive
#> NULL
#>
#> $LPS$overall_ROC
#> NULL
#>
#> $LPS$overall_CV
#> NULL
#>
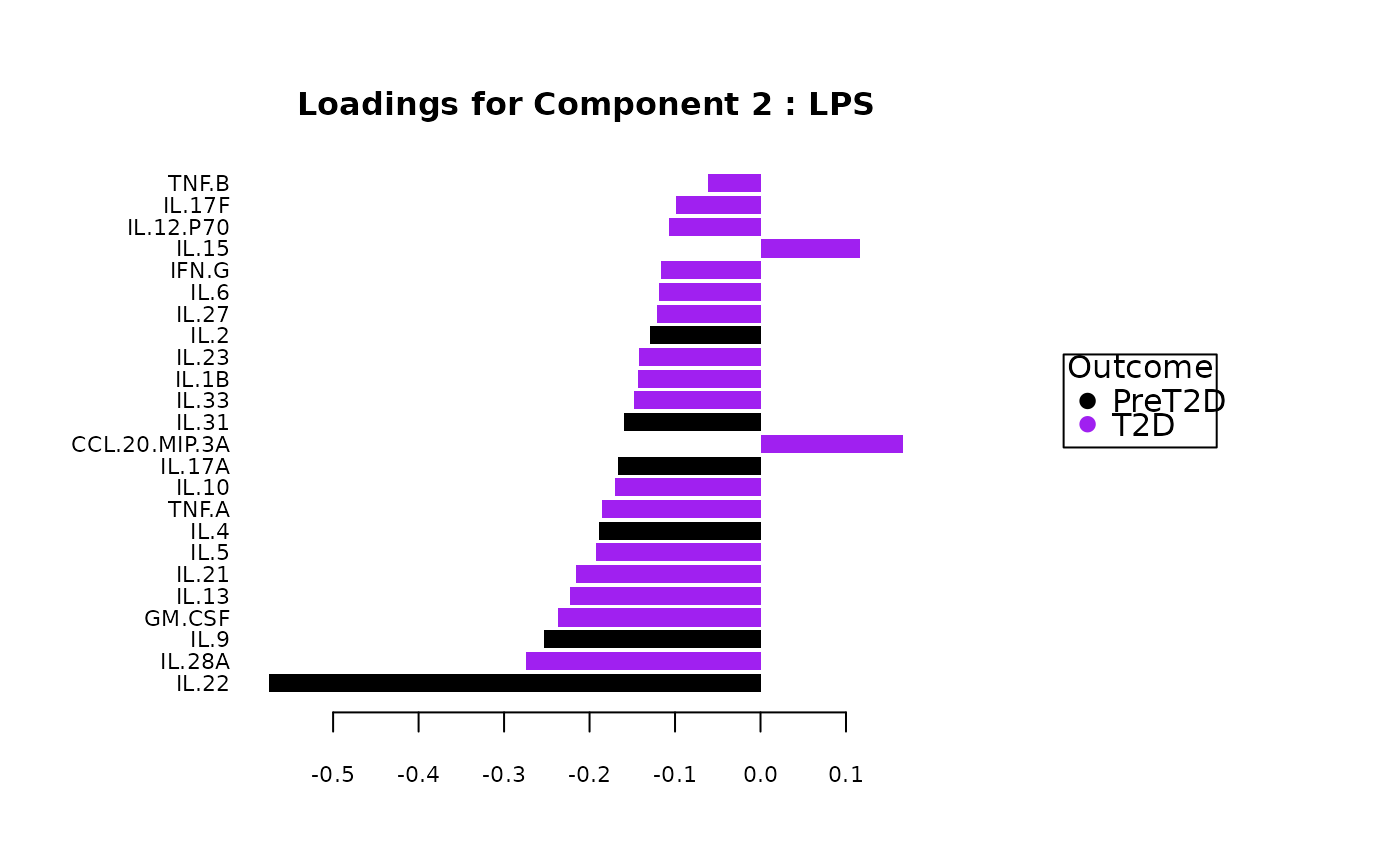
#> $LPS$loadings
#> $LPS$loadings[[1]]
#>
#> $LPS$loadings[[2]]
#>
#>
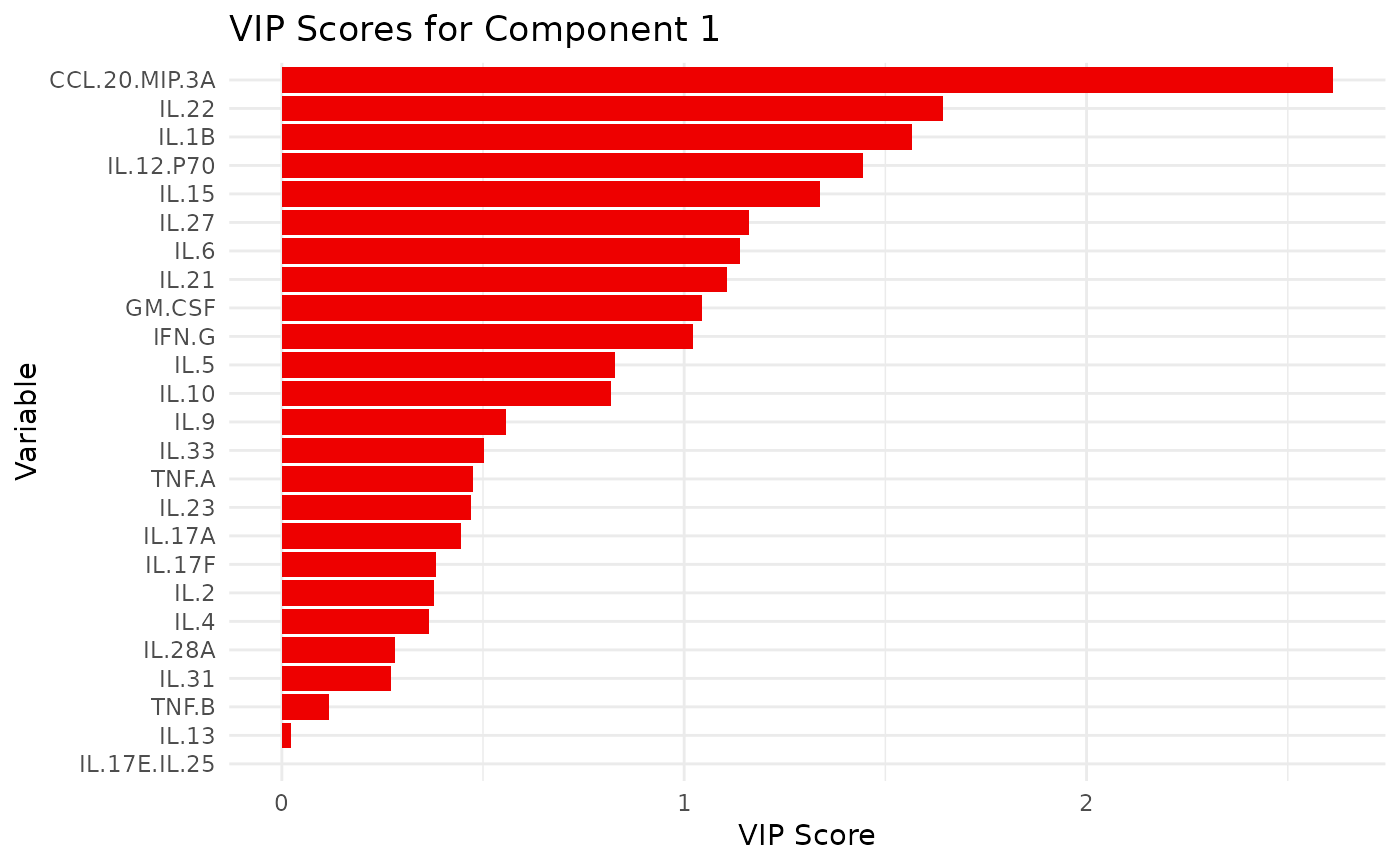
#> $LPS$vip_scores
#> $LPS$vip_scores[[1]]
 #>
#> $LPS$vip_scores[[2]]
#>
#> $LPS$vip_scores[[2]]
 #>
#>
#> $LPS$vip_indiv_plot
#>
#> $LPS$vip_loadings
#> $LPS$vip_loadings[[1]]
#>
#> $LPS$vip_loadings[[2]]
#>
#>
#> $LPS$vip_3D
#> NULL
#>
#> $LPS$vip_3D_interactive
#> NULL
#>
#> $LPS$vip_ROC
#> NULL
#>
#> $LPS$vip_CV
#> NULL
#>
#> $LPS$conf_matrix
#> NULL
#>
#>
#>
#>
#> $LPS$vip_indiv_plot
#>
#> $LPS$vip_loadings
#> $LPS$vip_loadings[[1]]
#>
#> $LPS$vip_loadings[[2]]
#>
#>
#> $LPS$vip_3D
#> NULL
#>
#> $LPS$vip_3D_interactive
#> NULL
#>
#> $LPS$vip_ROC
#> NULL
#>
#> $LPS$vip_CV
#> NULL
#>
#> $LPS$conf_matrix
#> NULL
#>
#>