Analyze data with MINT Sparse Partial Least Squares Discriminant Analysis (sPLS-DA).
Source:R/cyt_mint_splsda.R
cyt_mint_splsda.RdThis function performs a MINT (Multivariate INTegrative) sPLS-DA to handle
batch effects by modeling a global biological signal across different studies or batches.
If a second grouping column (group_col2) is provided, the analysis is stratified
and performed for each level of that column.
Usage
cyt_mint_splsda(
  data,
  group_col,
  batch_col,
  group_col2 = NULL,
  colors = NULL,
  output_file = NULL,
  ellipse = TRUE,
  bg = FALSE,
  var_num = 20,
  comp_num = 2,
  cim = FALSE,
  scale = NULL,
  roc = FALSE,
  font_settings = NULL,
  progress = NULL,
  custom_fn = NULL
)
Arguments
- data
A matrix or data frame containing the variables. Columns not specified by
group_col,group_col2, ormultilevel_colare assumed to be continuous variables for analysis.- group_col
A string specifying the first grouping column name that contains grouping information. If
group_col2is not provided, it will be used for both grouping and treatment.- batch_col
A string specifying the batch column name that contains batch information.
- group_col2
A string specifying the second grouping column name. Default is
NULL.- colors
A vector of colors for the groups or treatments. If
NULL, a random palette (usingrainbow) is generated based on the number of groups.- output_file
A string specifying the file name for saving the PDF output. If set to NULL, the function runs in interactive mode.
- ellipse
Logical. Whether to draw a 95\ Default is
FALSE.- bg
Logical. Whether to draw the prediction background in the figures. Default is
FALSE.- var_num
Numeric. The number of variables to be used in the PLS-DA model.
- comp_num
Numeric. The number of components to calculate in the sPLS-DA model. Default is 2.
- cim
Logical. Whether to compute and plot the Clustered Image Map (CIM) heatmap. Default is
FALSE.- scale
Character. Optional transformation applied to numeric predictors. Supported values are
NULL(default; no transformation),"none","log2","log10","zscore", or"custom".- roc
Logical. Whether to compute and plot the ROC curve for the model. Default is
FALSE.- font_settings
Optional named list of font sizes for supported plot text elements.
- progress
Optional. A Shiny
Progressobject for reporting progress updates.- custom_fn
Optional transformation function used when
scale = "custom".
Value
In Download mode, a PDF file is written. In Interactive mode, a named list
(results_list) of plots and results is returned. If group_col2 is used,
a nested list is returned, with each element corresponding to a level of group_col2.
References
Rohart F, Eslami A, Matigian, N, Bougeard S, Le Cao K-A (2017). MINT: A multivariate integrative approach to identify a reproducible biomarker signature across multiple experiments and platforms. BMC Bioinformatics 18:128.
Examples
# Loading ExampleData5 dataset with batch column
data_df <- ExampleData5[,-c(2,4)]
data_df <- dplyr::filter(data_df, Group != "ND")
cyt_mint_splsda(data_df, group_col = "Group",
batch_col = "Batch", colors = c("black", "purple"),
ellipse = TRUE, var_num = 25, comp_num = 2,
scale = "log2")
 #> $global_indiv_plot
#>
#> $partial_indiv_plot
#>
#> $correlation_circle_plot
#>
#> $cim_obj
#> NULL
#>
#> $partial_loadings_plots
#> $partial_loadings_plots$`Comp 1 - batch_col: 1`
#>
#> $partial_loadings_plots$`Comp 1 - batch_col: 2`
#>
#> $partial_loadings_plots$`Comp 1 - batch_col: 3`
#>
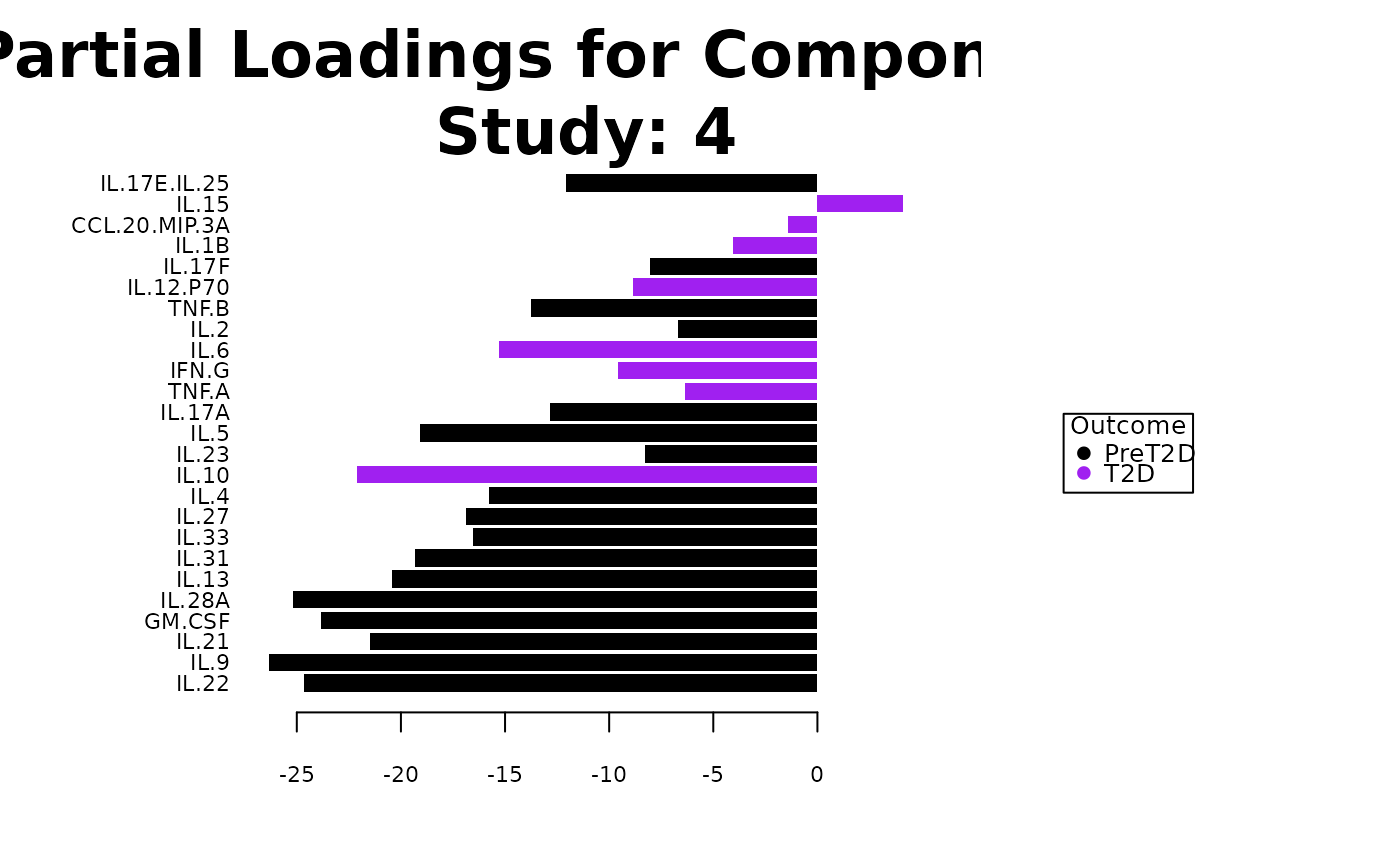
#> $partial_loadings_plots$`Comp 1 - batch_col: 4`
#>
#> $partial_loadings_plots$`Comp 2 - batch_col: 1`
#>
#> $partial_loadings_plots$`Comp 2 - batch_col: 2`
#>
#> $partial_loadings_plots$`Comp 2 - batch_col: 3`
#>
#> $partial_loadings_plots$`Comp 2 - batch_col: 4`
#>
#>
#> $roc_plot
#> NULL
#>
#> $global_indiv_plot
#>
#> $partial_indiv_plot
#>
#> $correlation_circle_plot
#>
#> $cim_obj
#> NULL
#>
#> $partial_loadings_plots
#> $partial_loadings_plots$`Comp 1 - batch_col: 1`
#>
#> $partial_loadings_plots$`Comp 1 - batch_col: 2`
#>
#> $partial_loadings_plots$`Comp 1 - batch_col: 3`
#>
#> $partial_loadings_plots$`Comp 1 - batch_col: 4`
#>
#> $partial_loadings_plots$`Comp 2 - batch_col: 1`
#>
#> $partial_loadings_plots$`Comp 2 - batch_col: 2`
#>
#> $partial_loadings_plots$`Comp 2 - batch_col: 3`
#>
#> $partial_loadings_plots$`Comp 2 - batch_col: 4`
#>
#>
#> $roc_plot
#> NULL
#>