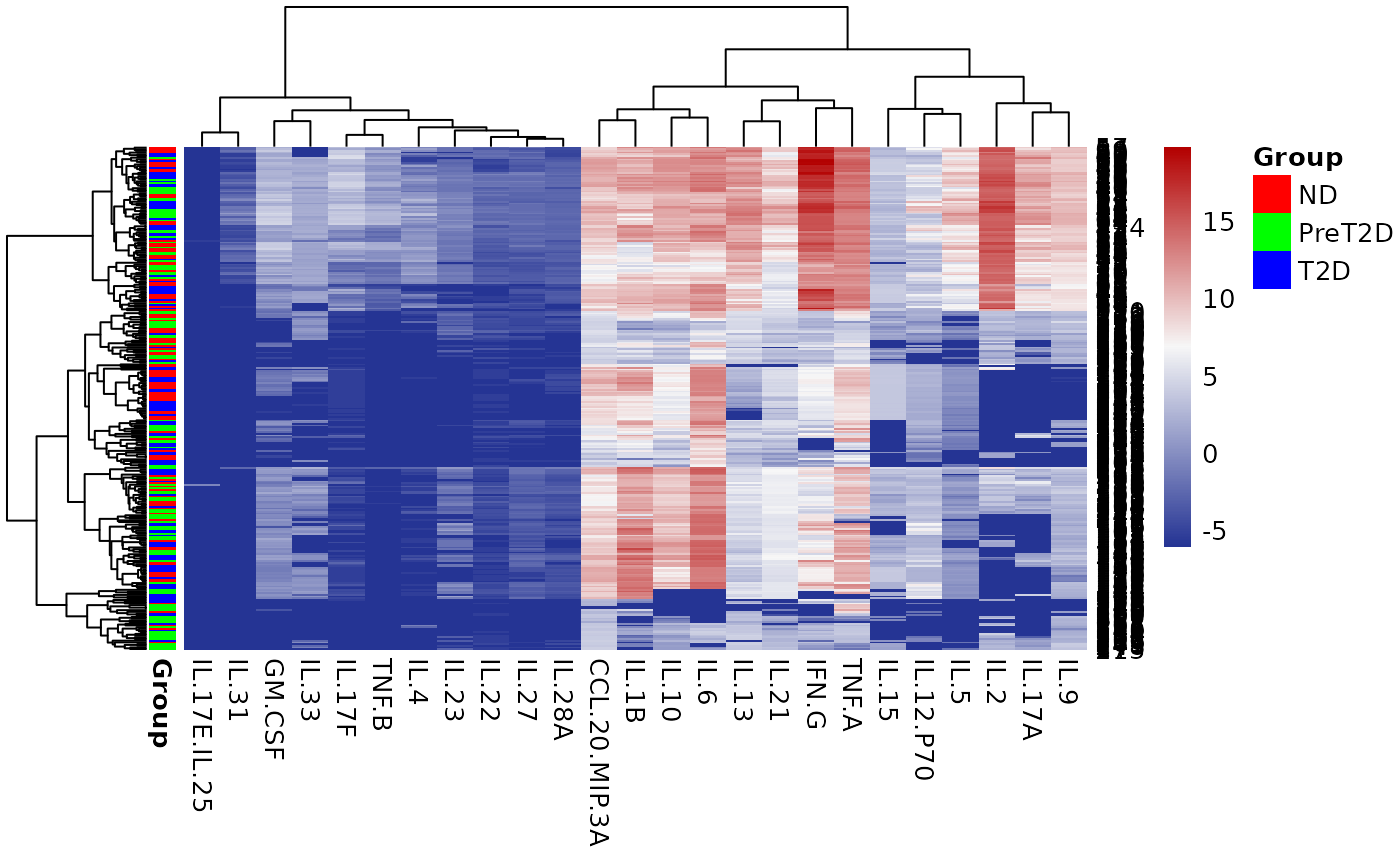
This function creates a heatmap using the numeric columns from the provided
data frame. It provides the ability to hide row and column names, adjust
font sizes and clustering, and apply additional transformations such as
log10 or combined z-scoring. An optional title is displayed as the
plot title; an optional filename (ending in .pdf or
.png) saves the heat map to disk. Both may be supplied together.
Usage
cyt_heatmap(
  data,
  scale = NULL,
  annotation_col = NULL,
  annotation_side = c("auto", "row", "col"),
  show_row_names = FALSE,
  show_col_names = TRUE,
  fontsize_row = 10,
  fontsize_col = 10,
  font_settings = NULL,
  cluster_rows = TRUE,
  cluster_cols = TRUE,
  title = NULL,
  filename = NULL,
  progress = NULL
)
Arguments
- data
A data frame. Only numeric columns are used to construct the heat map.
- scale
Character specifying an optional scaling. One of
NULL(no scaling),"log2","log10","row_zscore","col_zscore", or"zscore"(apply both row and column z-scoring). Default isNULL.- annotation_col
Optional. Either the name of a column in
dataor a vector of length equal to the number of rows or columns of the numeric matrix. If a column name is supplied the function determines whether it annotates rows or columns based on its length or the value ofannotation_side.- annotation_side
Character. One of
"auto"(default),"row", or"col". When"auto"the side is determined by matching the length ofannotation_colto rows or columns.- show_row_names
Logical. If
TRUErow names are shown. Default isFALSE.- show_col_names
Logical. If
FALSEcolumn names are hidden. Default isTRUE.- fontsize_row
Numeric. Font size for row names. Default is
10.- fontsize_col
Numeric. Font size for column names. Default is
10.- font_settings
Optional named list of font sizes for supported heatmap text elements.
- cluster_rows
Logical. If
TRUE(default), rows are clustered.- cluster_cols
Logical. If
TRUE(default), columns are clustered.- title
Character. Optional title displayed at the top of the heat map. If
NULL(default), no title is printed.- filename
Character. Optional file path ending in
".pdf"or".png"(case insensitive). When supplied the heat map is written to disk and screen rendering is suppressed. IfNULL(default), the plot is drawn on the active graphics device.- progress
Optional. A Shiny
Progressobject for reporting progress updates.
Value
Invisibly returns the pheatmap object created by
pheatmap::pheatmap().