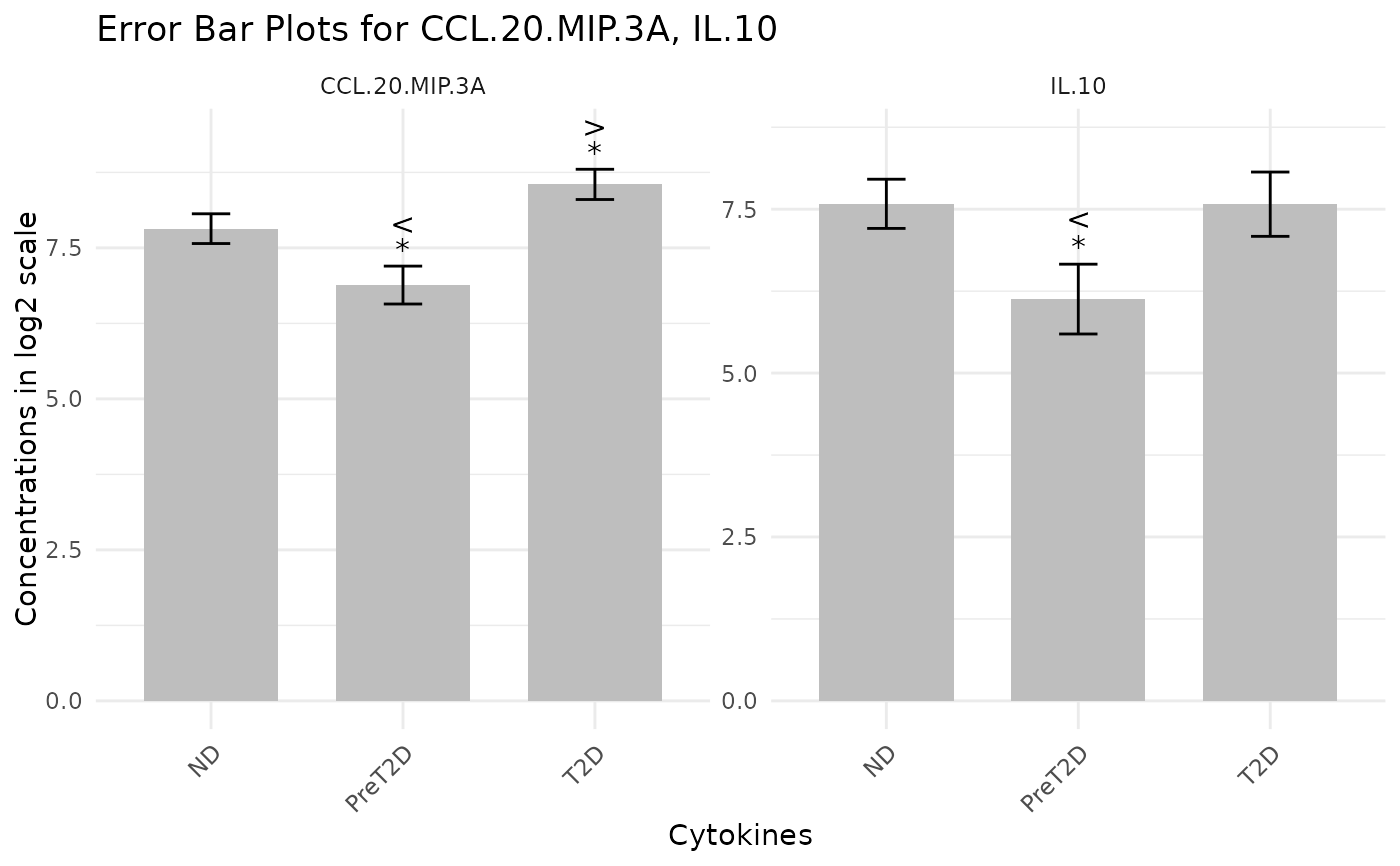
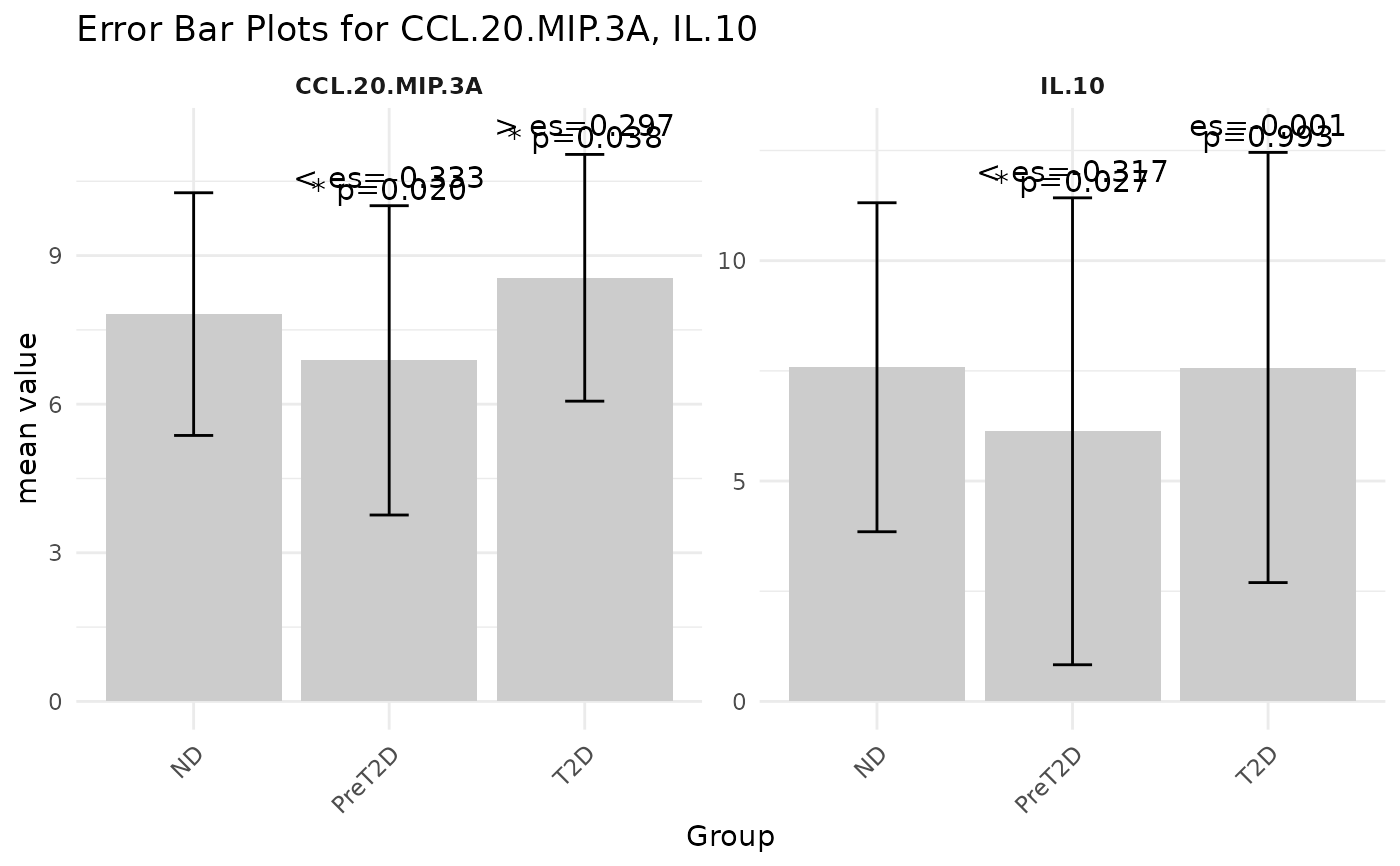
This function generates an error-bar plot to visually compare different groups against a designated baseline group. It displays the central tendency (mean or median) as a bar and overlays error bars to represent the data's spread (e.g., standard deviation, MAD, or standard error). The plot can also include p-value and effect size labels (based on SSMD), presented either as symbols or numeric values, to highlight significant differences and the magnitude of effects. When an output filename is provided the plot is saved to disk; otherwise the ggplot object is returned and drawn on the current graphics device.
Usage
cyt_errbp(
  data,
  group_col = NULL,
  p_lab = TRUE,
  es_lab = TRUE,
  class_symbol = FALSE,
  x_lab = "",
  y_lab = "",
  title = "",
  stat = c("mean", "median"),
  error = c("se", "sd", "mad", "ci"),
  scale = c("none", "log2", "log10", "zscore", "custom"),
  custom_fn = NULL,
  method = c("auto", "ttest", "wilcox"),
  p_adjust_method = NULL,
  label_size = 4,
  n_col = NULL,
  base_size = 11,
  fill_palette = NULL,
  font_settings = NULL,
  output_file = NULL,
  progress = NULL
)
Arguments
- data
A data frame containing at least one numeric column and a grouping column.
- group_col
Character string naming the column that defines groups. This column will be coerced to a factor.
- p_lab
Logical. If
TRUE(default) p-value labels are displayed for group comparisons.- es_lab
Logical. If
TRUE(default) effect-size labels are displayed.- class_symbol
Logical. If
TRUE, p-value and effect-size labels are encoded using symbols (e.g.,*,>>>). IfFALSE(default), numeric values are shown instead.- x_lab
Character string for the x-axis label. If empty a default label is generated.
- y_lab
Character string for the y-axis label. If empty a default label is generated.
- title
Character string for the plot title. If empty a default title is generated.
- stat
Character. Central tendency statistic to use. One of
"mean"(default) or"median".- error
Character. Error measure visualized around the statistic. One of
"se"(standard error; default),"sd"(standard deviation),"mad"(median absolute deviation), or"ci"(approximate 95% confidence interval).- scale
Character controlling data transformation before analysis. One of
"none"(default),"log2","log10","zscore", or"custom".- custom_fn
A user-supplied function applied to numeric columns when
scale = "custom".- method
Character controlling the statistical test used for pairwise comparisons. One of
"auto"(default; choose between t-test and Wilcoxon based on a normality test),"ttest", or"wilcox".- p_adjust_method
Character. If non-
NULL, specifies the method passed top.adjust()to correct p-values across all comparisons (e.g.,"BH"for Benjamini-Hochberg).NULL(default) skips adjustment.- label_size
Numeric. Font size for p-value and effect-size labels. Default is
4.- n_col
Integer. Number of columns in the facet grid. If
NULL(default), usesmin(3, number_of_cytokines).- base_size
Numeric. Base font size for the plot theme. Default is
11.- fill_palette
Character vector of colors for the group bars. If
NULL(default), all bars are filled with"gray80". Supply one color per group level (e.g.c("#4E79A7", "#F28E2B", "#E15759")).- font_settings
Optional named list of font sizes for supported plot text elements.
- output_file
Optional file path. If provided, the plot is saved using
ggsave(); otherwise the plot is returned and automatically printed.- progress
Optional. A Shiny
Progressobject for reporting progress updates.