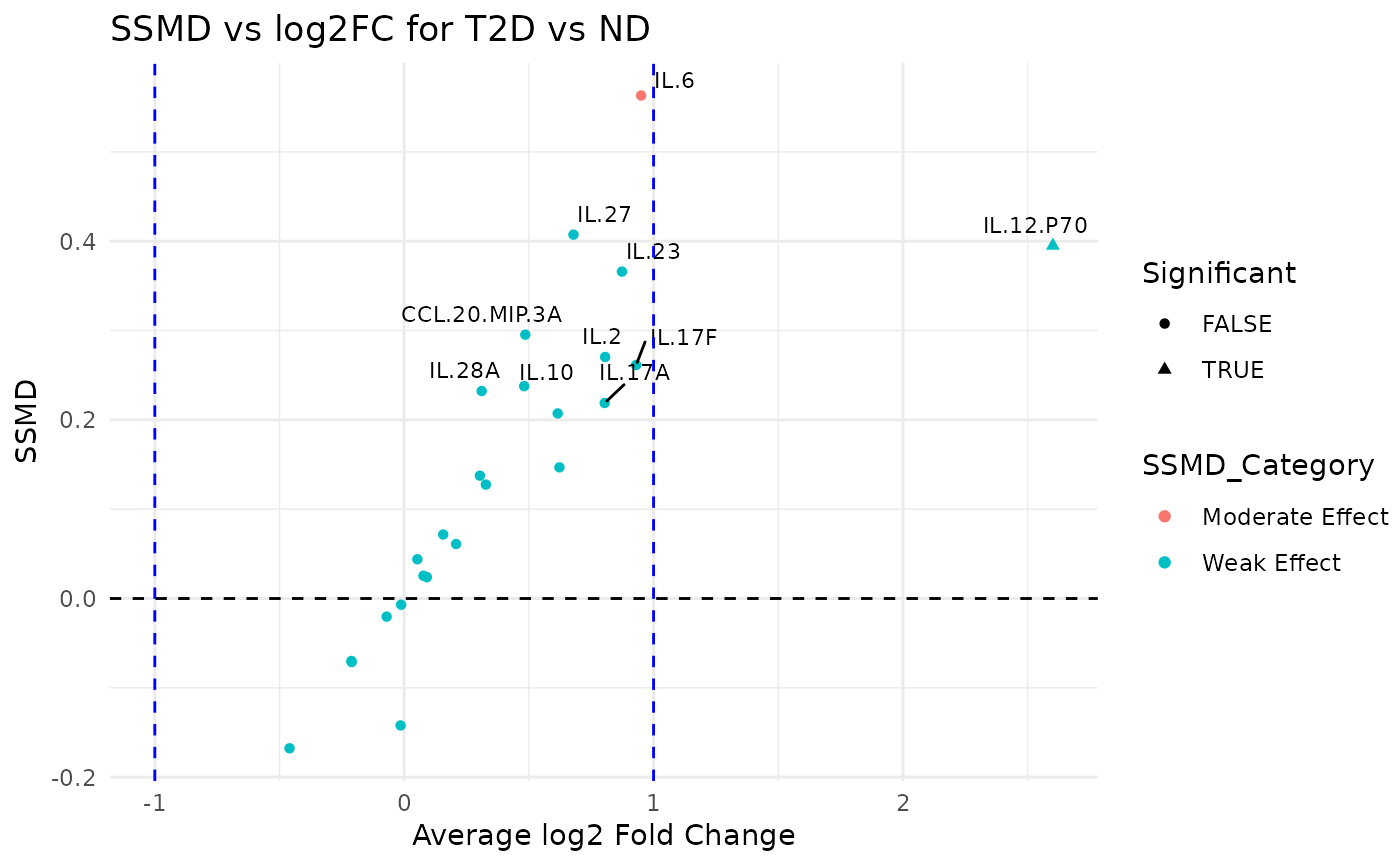
This function reshapes the input data and computes summary statistics (mean and variance) for each variable grouped by a specified grouping column. It then calculates the SSMD (Strictly Standardized Mean Difference) and log2 fold change between two groups (group1 and group2) and categorizes the effect strength. A dual flash plot is generated using ggplot2 where the x-axis represents the average log2 fold change and the y-axis represents the SSMD.
Usage
cyt_dualflashplot(
  data,
  group_var,
  group1,
  group2,
  ssmd_thresh = 1,
  log2fc_thresh = 1,
  top_labels = 15,
  output_file = NULL,
  font_settings = NULL,
  progress = NULL
)
Arguments
- data
A data frame containing the input data.
- group_var
A string specifying the name of the grouping column in the data.
- group1
A string representing the name of the first group for comparison.
- group2
A string representing the name of the second group for comparison.
- ssmd_thresh
A numeric threshold for the SSMD value used to determine significance (default = 1).
- log2fc_thresh
A numeric threshold for the log2 fold change used to determine significance (default = 1).
- top_labels
An integer specifying the number of top variables (based on absolute SSMD) to label in the plot (default = 15).
- output_file
Optional. A file path to save the plot as a PDF (or PNG if extension is .png). If NULL (default), the function returns a ggplot object.
- font_settings
Optional named list of font sizes for supported plot text elements.
- progress
Optional. A Shiny
Progressobject for reporting progress updates.
Value
If output_file is NULL, a ggplot object representing the dual-flash plot is returned; otherwise, the plot is saved to the specified file and the function returns NULL invisibly.
Examples
data_df <- ExampleData1[, -c(2:3)]
cyt_dualflashplot(
  data_df,
  group_var = "Group",
  group1 = "T2D",
  group2 = "ND",
  ssmd_thresh = -0.2,
  log2fc_thresh = 1,
  top_labels = 10
)
#> $plot

#>
#> $stats
#> # A tibble: 25 × 11
#>    cytokine         mean_ND mean_PreT2D mean_T2D variance_ND variance_PreT2D
#>    <chr>              <dbl>       <dbl>    <dbl>       <dbl>           <dbl>
#>  1 CCL.20.MIP.3A   634.        404.       887.      6.72e+ 5         2.74e+5
#>  2 GM.CSF            2.65        3.11       1.92    2.63e+ 1         3.14e+1
#>  3 IFN.G         57730.      18303.     61484.      2.86e+10         2.30e+9
#>  4 IL.10           979.        836.      1366.      1.99e+ 6         1.19e+6
#>  5 IL.12.P70        13.0        39.1       78.9     4.15e+ 2         2.56e+4
#>  6 IL.13          1064.       1543.      1122.      5.60e+ 6         1.11e+7
#>  7 IL.15             7.92        4.29       8.22    3.54e+ 1         2.58e+1
#>  8 IL.17A          352.        653.       615.      9.40e+ 5         2.88e+6
#>  9 IL.17E.IL.25      0.0101      0.0163     0.01    1.01e- 6         3.88e-3
#> 10 IL.17F            1.63        2.35       3.11    1.56e+ 1         3.37e+1
#> # ℹ 15 more rows
#> # ℹ 5 more variables: variance_T2D <dbl>, ssmd <dbl>, log2FC <dbl>,
#> #   SSMD_Category <chr>, Significant <lgl>
#>
#>
#> $stats
#> # A tibble: 25 × 11
#> cytokine mean_ND mean_PreT2D mean_T2D variance_ND variance_PreT2D
#> <chr> <dbl> <dbl> <dbl> <dbl> <dbl>
#> 1 CCL.20.MIP.3A 634. 404. 887. 6.72e+ 5 2.74e+5
#> 2 GM.CSF 2.65 3.11 1.92 2.63e+ 1 3.14e+1
#> 3 IFN.G 57730. 18303. 61484. 2.86e+10 2.30e+9
#> 4 IL.10 979. 836. 1366. 1.99e+ 6 1.19e+6
#> 5 IL.12.P70 13.0 39.1 78.9 4.15e+ 2 2.56e+4
#> 6 IL.13 1064. 1543. 1122. 5.60e+ 6 1.11e+7
#> 7 IL.15 7.92 4.29 8.22 3.54e+ 1 2.58e+1
#> 8 IL.17A 352. 653. 615. 9.40e+ 5 2.88e+6
#> 9 IL.17E.IL.25 0.0101 0.0163 0.01 1.01e- 6 3.88e-3
#> 10 IL.17F 1.63 2.35 3.11 1.56e+ 1 3.37e+1
#> # ℹ 15 more rows
#> # ℹ 5 more variables: variance_T2D <dbl>, ssmd <dbl>, log2FC <dbl>,
#> # SSMD_Category <chr>, Significant <lgl>
#>