![[Deprecated]](figures/lifecycle-deprecated.svg)
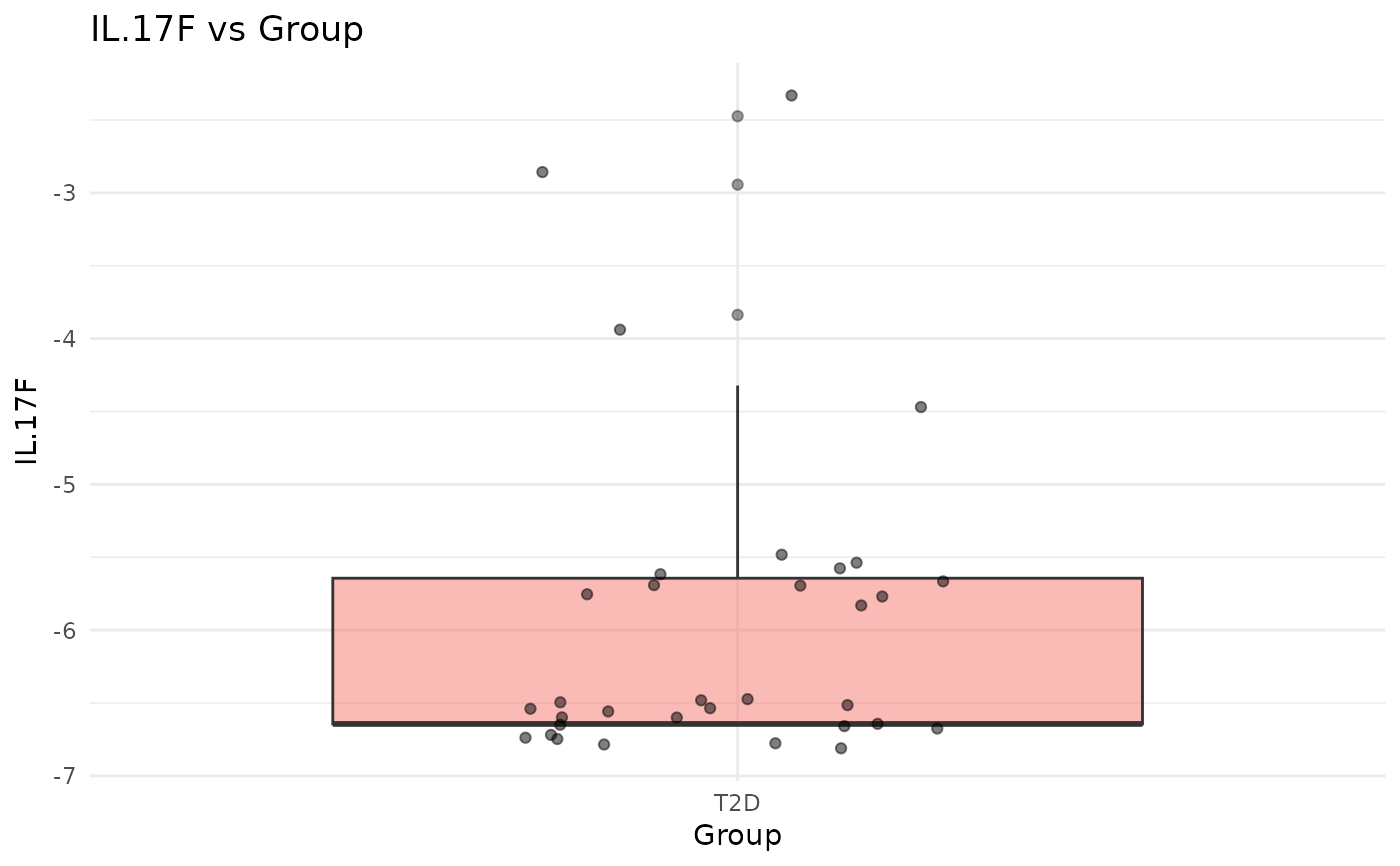
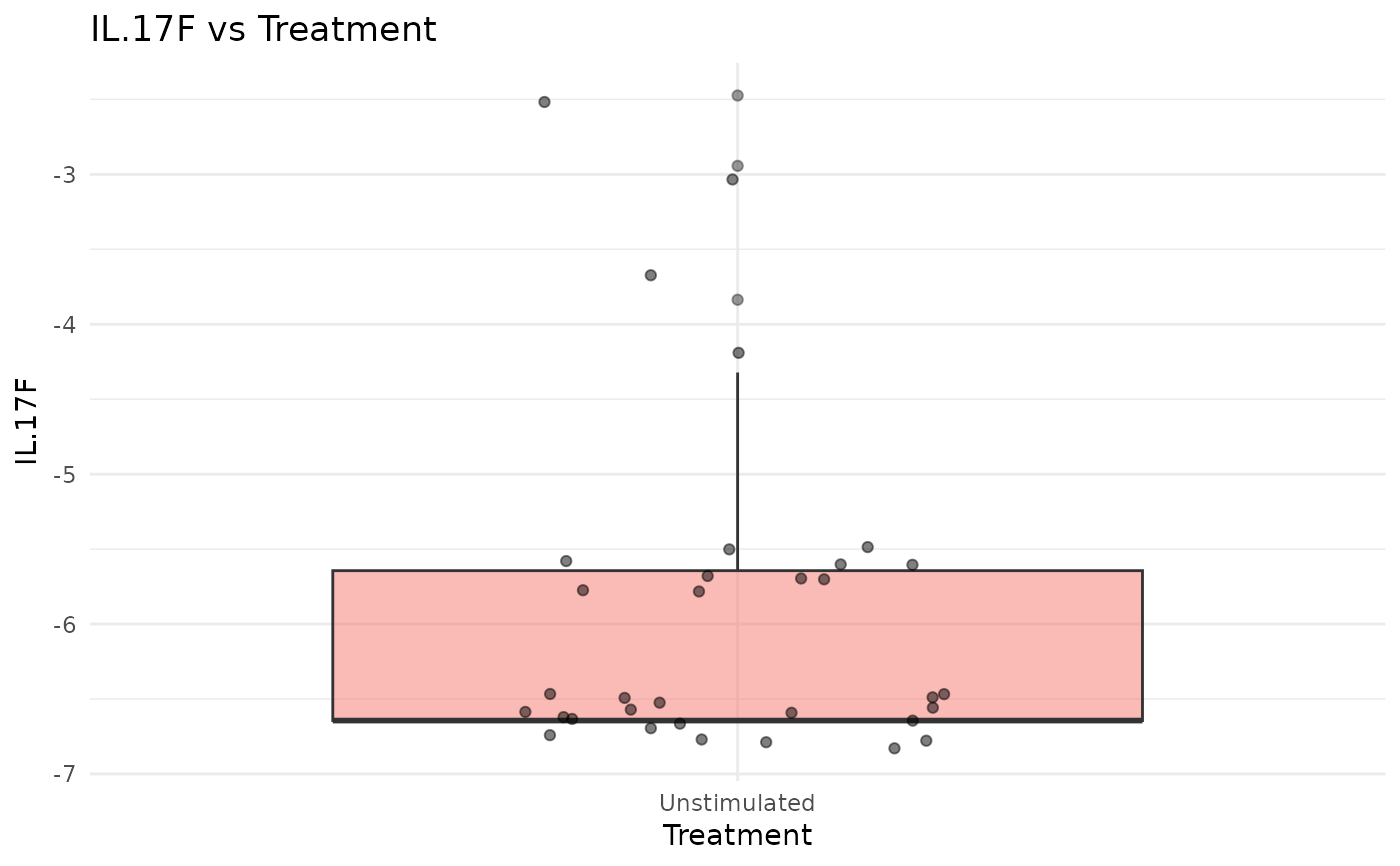
This function generates boxplots for each combination of numeric and factor variables in the provided data.
Character columns are converted to factors and the function checks that the
data contains at least one numeric and one factor column. If the scale
argument is provided, numeric columns are transformed with the shared
scaling helper before plotting. The function then creates boxplots using
ggplot2 for each numeric variable grouped by each factor variable.
If output_file is provided, the plots are saved to that PDF file; otherwise, a list of ggplot objects is returned.
Usage
cyt_bp2(
  data,
  output_file = NULL,
  mf_row = c(1, 1),
  scale = NULL,
  y_lim = NULL,
  progress = NULL,
  custom_fn = NULL
)
Arguments
- data
A matrix or data frame of raw data.
- output_file
Optional. A string representing the file path for the PDF file to be created. If NULL (default), the function returns a list of ggplot objects.
- mf_row
A numeric vector of length two specifying the layout (rows and columns) for the plots in the PDF output. Defaults to c(1, 1). (Ignored when returning ggplot objects.)
- scale
Transformation option for continuous variables. Options are
NULL(default; no transformation),"none","log2","log10","zscore", or"custom".- y_lim
An optional numeric vector defining the y-axis limits for the plots.
- progress
Optional. A Shiny
Progressobject for reporting progress updates.- custom_fn
Optional transformation function used when
scale = "custom".
Value
If output_file is NULL, returns a list of ggplot objects (named as "num_vs_factor" for each combination).
If output_file is provided, a PDF file is created and the function returns NULL invisibly.
Examples
# Loading data
data_df <- ExampleData1[, -c(3, 5:28)]
data_df <- dplyr::filter(data_df, Group == "T2D", Treatment == "Unstimulated")
cyt_bp2(data_df, output_file = NULL, scale = "log2")
#> Warning: `cyt_bp2()` was deprecated in CytokineProfileShinyApp 0.0.1.
#> ℹ Please use `cyt_bp()` instead.
#> $IL.17F_vs_Group

#>
#> $IL.17F_vs_Treatment

#>
#> $IL.17F_vs_Treatment
 #>
#>