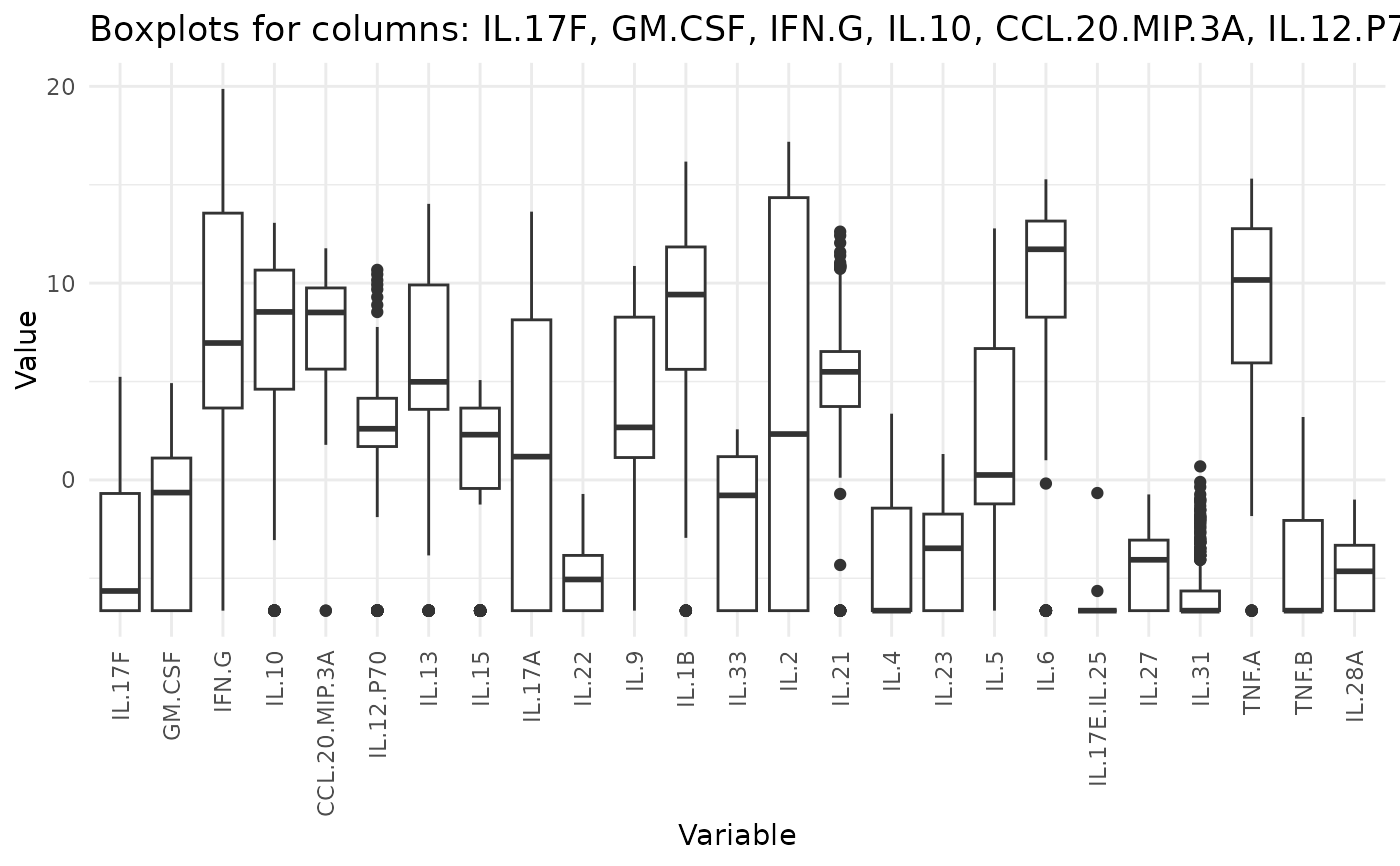
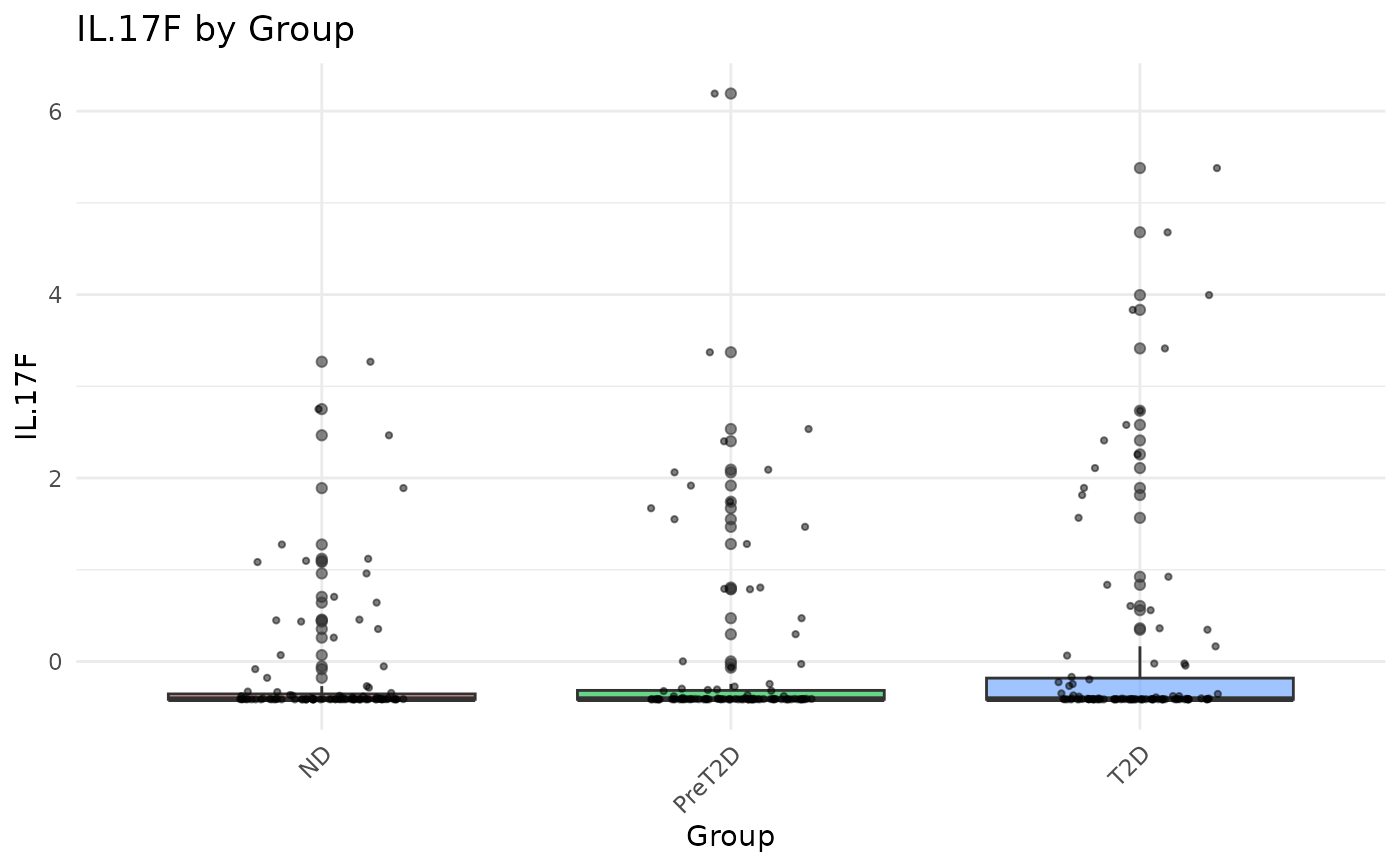
This function generates boxplots for numeric variables in a data frame or matrix. It supports optional grouping by one or more categorical variables. Numeric variables can be scaled using various transformations before plotting. When grouping is not used, boxplots are arranged in pages with a specified maximum number of plots per page. Plots can be saved to a PDF file or returned as a list of ggplot2 objects.
Usage
cyt_bp(
  data,
  output_file = NULL,
  group_by = NULL,
  bin_size = 25,
  y_lim = NULL,
  scale = c("none", "log2", "log10", "zscore", "custom"),
  custom_fn = NULL,
  font_settings = NULL,
  progress = NULL
)
Arguments
- data
A matrix or data frame containing numeric and categorical variables.
- output_file
Optional string specifying the name of the file to be created. When
NULL(default), plots are drawn on the current graphics device. Ensure the file extension matches the desired format (e.g.,".pdf",".png",".tiff").- group_by
Optional character vector specifying one or more columns to use for grouping. If
NULL(default) no grouping is applied.- bin_size
Integer. Maximum number of boxplots per page when grouping is not used. Default is
25.- y_lim
Optional numeric vector giving y-axis limits for the plots. Applies to all plots.
- scale
Character specifying a transformation for numeric variables. One of
"none","log2","log10","zscore", or"custom". When"custom", supply a function viacustom_fn.- custom_fn
A user-supplied function to transform numeric columns when
scale = "custom".- font_settings
Optional named list of font sizes for supported plot text elements.
- progress
Optional. A Shiny
Progressobject for reporting progress updates.